Open datasets are a great source of interesting and varied information. This article shows how to build a local map of current traffic incidents, using Open Glasgow, Google Maps, and R.
Getting the data
Open Glasgow is a website giving access to data about Glasgow. It gives people the means to create interesting tools, which analyse or optimise living in the city.
The types of data and the topics covered are still being expanded, as the site only launched in July 2013. The data formats are also quite varied, but one that caught my eye is the Glasgow Road Network Traffic Events Feed. This provides data on traffic incidents in JSON format, which is relatively clean and readable for humans while also being easy to parse.
The JSON data can be accessed from the feed URL, then the JSON object converted to an R list using the fromJSON function in the RJSONIO library:
library("RJSONIO")
json <- readLines(url("http://dashboard.glasgow.gov.uk/api/live/trafficEvents.php?type=json"), warn=FALSE)
data.json <- fromJSON(json)
I’ve turned off warnings on the readLines call, since the JSON object sent by the server is not terminated with an EOF character. This throws a warning in R every time, which warn=FALSE suppresses.
That’s all there is to accessing a JSON feed in R! Now the data.json list can be inspected for its interesting contents.
Parsing the interesting bits
An R list is not a very user-friendly format for data to be in, since most functions expect a matrix or data frame. Also, the JSON object contains a lot of detail that I’m not really interested in, including the data model version number, the data provider, and a unique reference number.
The traffic incidents themselves are contained within an array called situation. Each situation contains a situationRecord, with details of the affected street, time, and description of the event. From examining these situationRecords, it seems that the most interesting information is:
- The time the record was created
- The start time of the situation
- The end time of the situation
- The status of the situation (which always seems to be “active”)
- The event type (such as road closure or traffic light not working)
- The location descriptor (usually a road name)
- The latitude and longitude of the situation
- A free text description of the situation.
I wrote a function which takes a situation, and extracts these key points into a data frame:
parse.situation <- function(sit)
{
    # Location descriptor position varies between a single point, and a list of points.
    # Try to fetch the descriptor. This will work if it's a single point.
    loc.descriptor <- sit$situationRecord$groupOfLocations$locationContainedInGroup$tpegpointLocation$point$name$descriptor

    # If it is a list of points, the descriptor will be null instead:
    if (is.null(loc.descriptor))
    {
        # In this case, use the first point's descriptor instead.
        points.list <- sit$situationRecord$groupOfLocations$locationContainedInGroup$tpegpointLocation$point$name
        loc.descriptor <- points.list[[1]]$descriptor
    }

    return (data.frame(as.POSIXct(strptime(sit$situationRecord$situationRecordCreationTime, format="%Y-%m-%dT%H:%M:%S")),
                       as.POSIXct(strptime(sit$situationRecord$validity$validityTimeSpecification[1], format="%Y-%m-%dT%H:%M:%S")),
                       as.POSIXct(strptime(sit$situationRecord$validity$validityTimeSpecification[2], format="%Y-%m-%dT%H:%M:%S")),
                       sit$situationRecord$validity$validityStatus,
                       sit$situationRecord[[length(sit$situationRecord)]],
                       loc.descriptor,
                       as.numeric(sit$situationRecord$groupOfLocations$locationContainedInGroup$tpegpointLocation$point$pointCoordinates[1]),
                       as.numeric(sit$situationRecord$groupOfLocations$locationContainedInGroup$tpegpointLocation$point$pointCoordinates[2]),
                       sit$situationRecord$nonGeneralPublicComment$comment,
                       row.names=NULL))
}
Most of these fields can be accessed directly by name, such as the situation status always being called validity$validityStatus. However, the location and the event type are slightly more complex.
Most situations have a single location, but some, such as a lane closure on a motorway, have a list of related locations. This affects the JSON format, and there is no single-line way to access both formats of location description. Instead, the code above first tries to access the location description as if it were a single point. If this returns NULL, it assumes it’s a list instead, and accesses the description of the first location in the list.
The event type is complicated by there being no single JSON field name for all types. For example, a trafficLightsNotWorking situation is recorded in a field called poorRoadInfrastructureType, whereas a roadClosed situation is recorded in the networkManagementType field. However, the event descriptor is consistently the final element in the situationRecord, which means it can be accessed using situationRecord[[length(sit$situationRecord)]].
This function can be applied to every situation in the list, and the parsed data bound together into one data frame, ready for further analysis:
data <- do.call(rbind, Map(parse.situation, data.json$payloadPublication$situation))
colnames(data) <- c("creation", "start", "end", "status", "event", "location", "latitude", "longitude", "description")

head(data)
Which gives:
             creation               start                 end status                   event         location latitude longitude description
1 2013-10-16 15:56:01 2013-10-29 22:00:00 2013-10-30 06:00:00 active trafficLightsNotWorking    VICTORIA ROAD 55.83509 -4.265301 All Dark: GJ252A & B Victoria Rd / Albert Rd and GJ250A & B Victoria Rd / Dixon Ave. All signals off.
2 2013-07-26 10:42:00 2013-08-30 00:01:00 2014-01-28 23:59:00 active              roadClosed ELMBANK CRESCENT 55.86448 -4.269042 ROAD CLOSURE: Elmbank Crescent, Pitt St, St Vincent Lane and St Peters Lane - Road closures in place for works
3 2013-03-15 10:17:25 2013-03-18 00:01:00 2013-12-31 23:59:00 active              roadClosed      BATH STREET 55.86322 -4.250174 ROAD CLOSURE: Cathedral Street will be closed between North Hanover Street and Dundas Street (Queen Street Station Bridge) to all vehicular tr
4 2013-10-03 09:10:16 2013-10-07 09:30:00 2013-11-10 18:00:00 active              roadClosed  OLD CASTLE ROAD 55.81784 -4.259365 ROAD CLOSURE: In order to allow for drainage works, Old Castle Road will be closed between Old Castle Gardens and Manse Brae/Delvin Road.
5 2013-10-09 14:14:00 2013-10-09 14:12:00 2013-10-23 17:00:00 active laneOrCarriagewayClosed   CROOKSTON ROAD 55.84394 -4.364215 LANE CLOSURE: Due to Scottish Water works the carriageway of Crookston Road between Crookston Drive and Hatton Gardens has been reduced from t
6 2013-05-10 10:48:41 2013-01-07 10:00:00 2014-06-19 17:00:00 active              roadClosed   HANOVER STREET 55.86034 -4.250503 ROAD CLOSURE: Closed northbound only for demolition and construction works.
(The truncated descriptions are as given in the JSON object. There must be a hard character limit somewhere further back in the system.)
Getting the map
Finally, I want to plot the situations on a map of Glasgow, so I can see which routes are currently affected. This can be done using Google’s Static Maps API, which returns an image based on parameters passed through a URL. The ggmap library in R contains a function to hide the details of this:
map.img <- get_googlemap(center="Glasgow,UK", zoom=12, maptype="roadmap")The list of traffic situations includes current and future events. It would be useful to separate these by colour, with red indicating ongoing situations, and blue for others. I’ll make a vector of the appropriate colours:
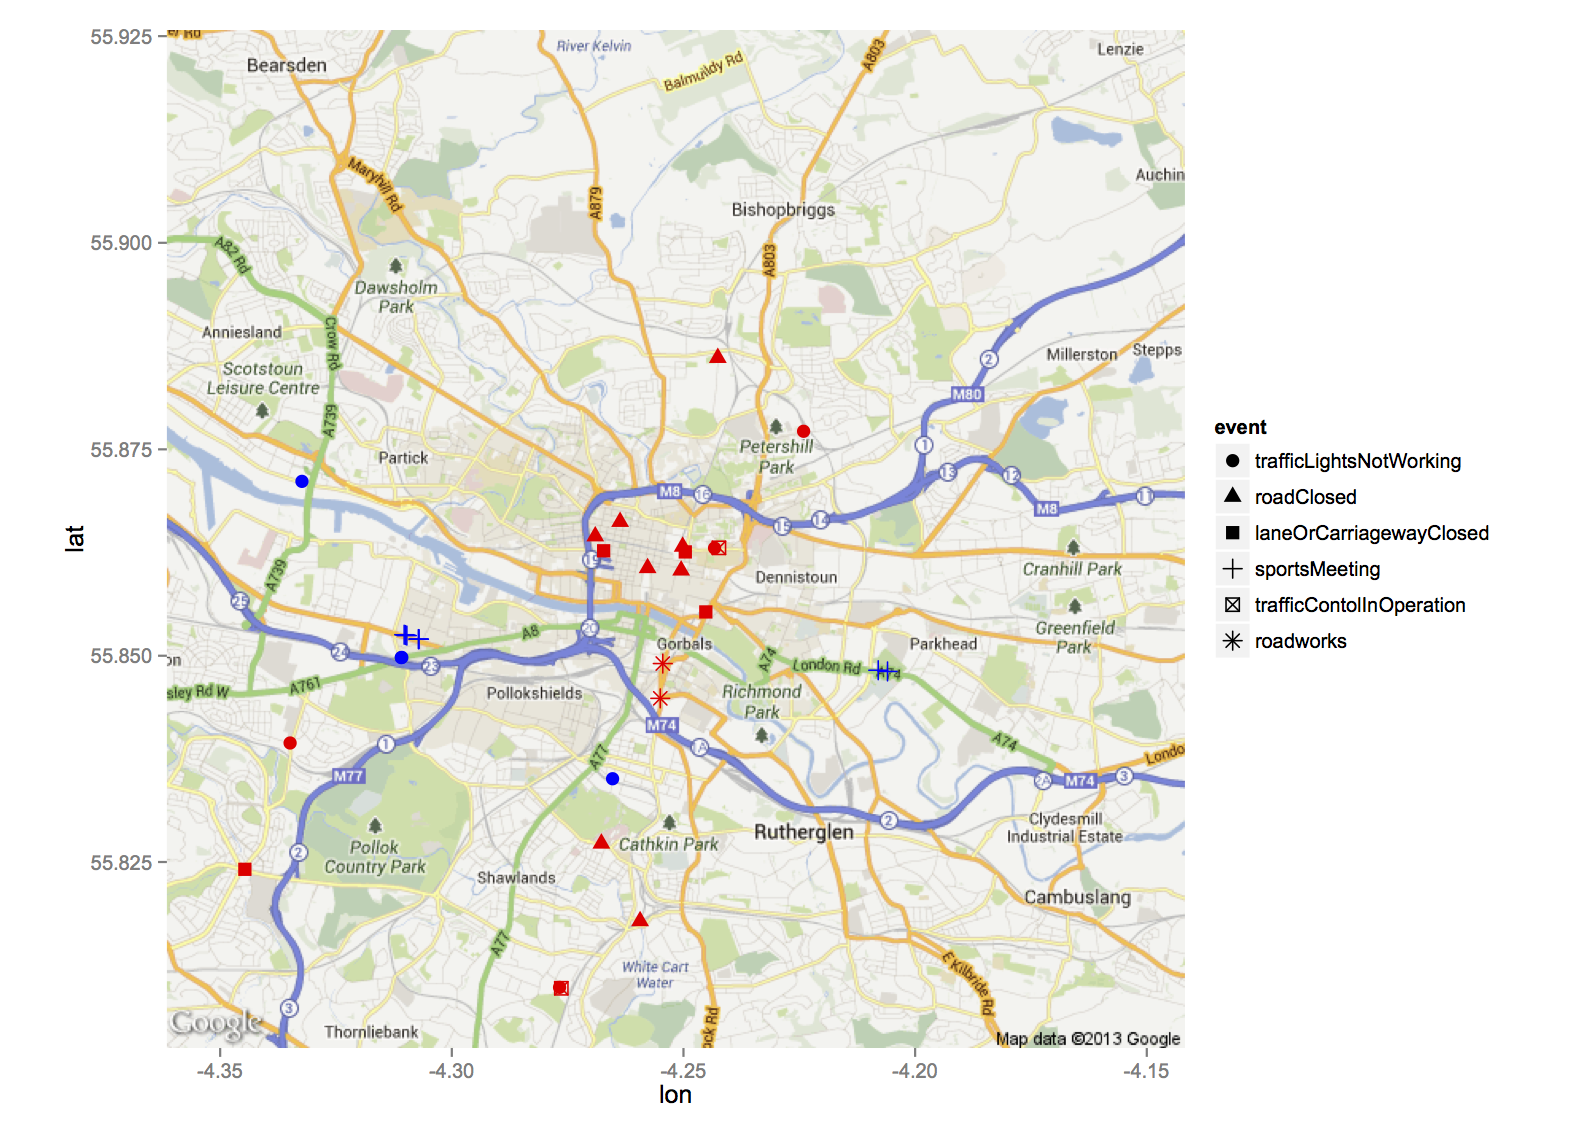
colour <- mapply(function (s, e) { if (s < Sys.time() && Sys.time() < e) { "red" } else { "blue" }}, data[,2], data[,3], SIMPLIFY=TRUE)Finally, I want to display the Google map with traffic situations overlayed. The shape of the point can be used to distinguish between the types of event:
print(ggmap(map.img) + geom_point(aes(x=longitude, y=latitude, shape=event, color=colour), data=cbind(data, colour), size=3) + scale_colour_identity())
Code
So that’s how to bring together a JSON data feed and a static Google map in R to generate a map of current road traffic events in Glasgow. Download the full program from GitHub.